


 573 / 1981

I I .
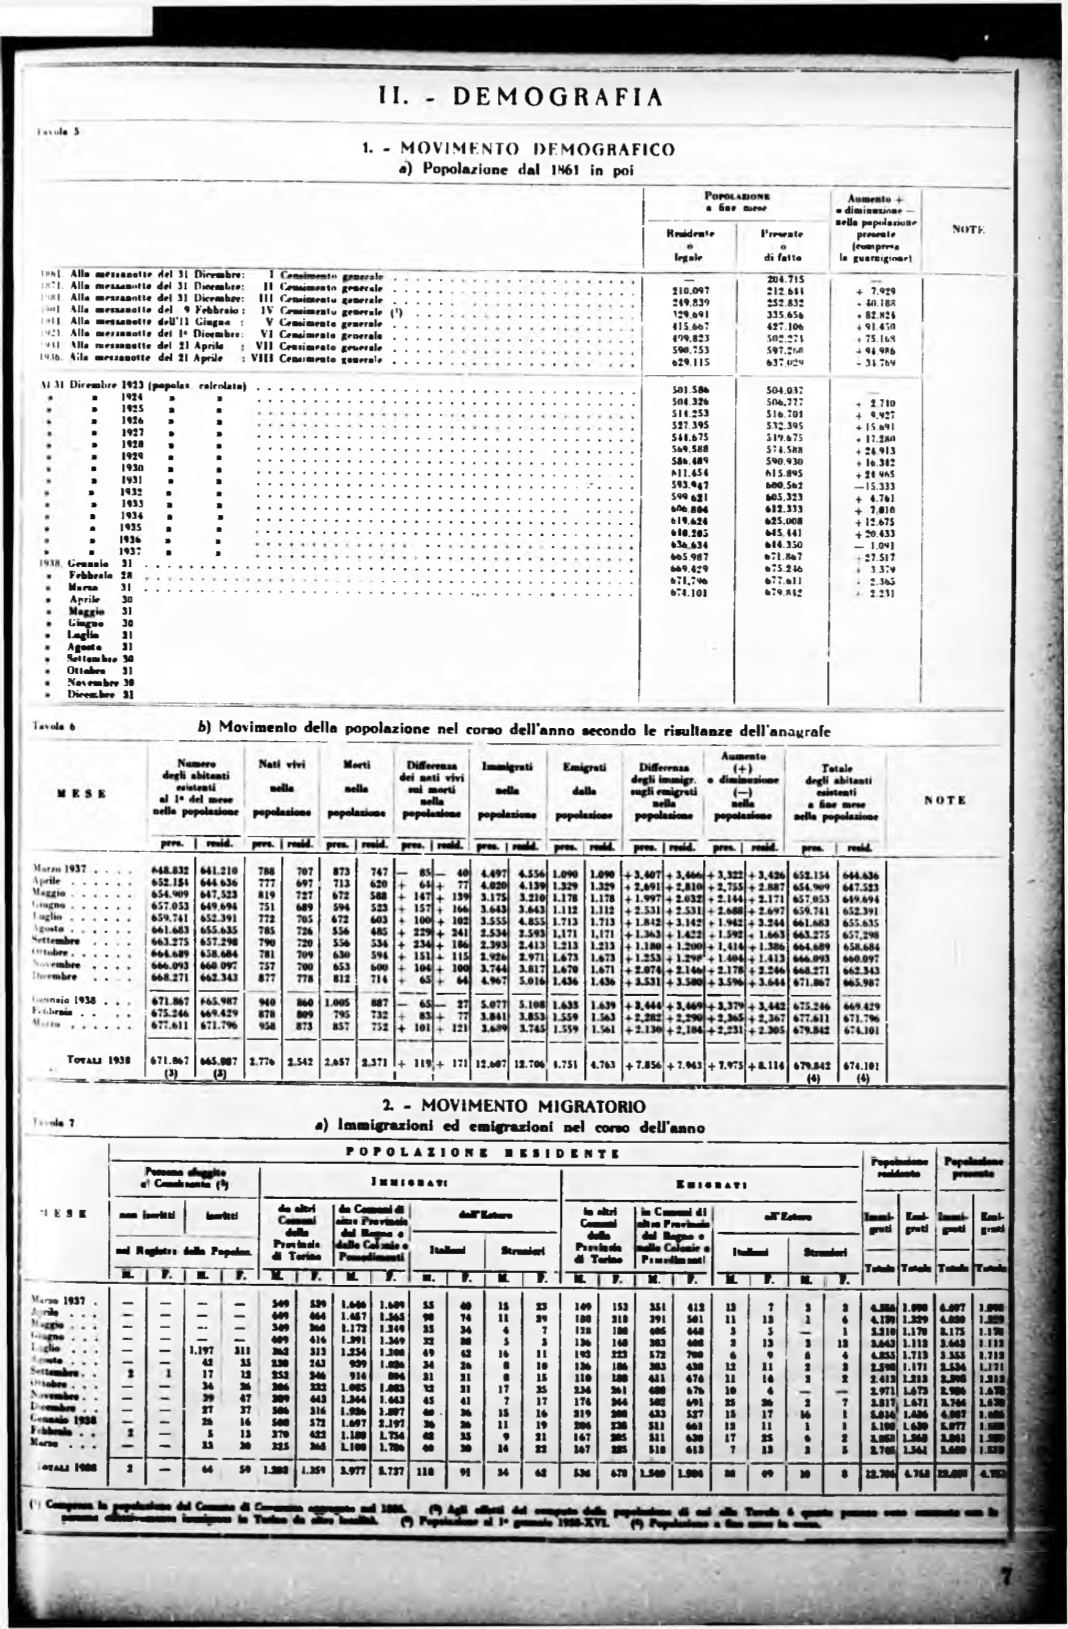
D E M O G R A F I A
1
. - M O V I M E NT O D E M O G R A F I C O
a )
Popolazione dal
1
S
61
in poi
1861. Alla m enano! tr «lei
IHT|. Alla m ftu n iillf del
l'tK l. AIU m m a a n llc del
'"I AIU mestano! te del
IM I
Alla m etsanotte dell'
1921. AIU m c/xanotte del
"H I
\IU m rxaanotte del
I9.V6.
Alla m csianotte del
Al .11
31 Dicembre:
31 Dicembre:
31 Dicembre:
9 Febbraio :
'11 C iufno :
1° Dicembre:
21 Aprile
21 Aprile
I
__________ _______
I l Onaimea lo generale . .
I l i Cenaimeato generale . .
IV Cenaimeato generale (*)
V Cenaimento generale . .
V I Cenaimeato grnerale . .
V II Cenaimeato generale . .
V ili Cenaimento generale . .
1 Dicembre 1923 (popola* calcolata)
a
192*
a
»
a
1925
a
a
a
1926
a
a
a
1927
a
a
a
1928
a
a
a
1929
a
a
a
1930
a
a
a
1931
a
a
a
1932
a
a
a
1933 a
a
a
1934
a
a
a
1935
a
a
a
1936
a
»
a
1937
a
»
Gennaio 31
Febbraio 28
Marco
31
Aprile 30
31
Giugno
lo g lio
30
91
Agoato 91
Settembre 30
Ottobre 31
N e\em bre 30
Dicembre _si
a fine mene
o dim inuxionr —
nella popolaxionr
preaente
(compresa
la guarnigione)
N OTE
Heaidente
legale
Preaeate
d i fatto
—
204.715
210.097
212 644
4- 7.929
249.839
252.832
4 40.188
329 691
335.656
* 82.824
415 667
427.106
4 91.450
499.823
502.274
♦75.I6S
590.753
597.260
4
94.986
629 115
637,029
4
34.769
501.586
504.037
504.326
506.777
4
2 710
514.253
516.701
4 9.127
527.395
S.32.39S
4 15.691
544.675
519.675
4
17.280
569.588
574.588
4
24 913
586.489
590.930
4
16.342
M 1.454
615.895
4
24 965
593.947
600.562
— 15.333
599.^21
605.323
4
4.761
606.804
612.333
4- 7 010
619.624
625.008
4 12.675
640.205
645 441
4 20.433
6.36 634
644.350
— 1.091
665.987
671.867
r 27.517
669.429
675.246
4 3.379
671.796
677.611
4
2.365
674.101
679.842
4-
2.231
b)
Movimento della popolazione nel corno dell'anno aecondo le risultanze ddl'ana^rafc
*inaio 1938
h >•tirato . .
T
otali
19 »
* 71-**7 *‘ * M 7 IT 7 ‘ 5 s ,: J »S7 1171 + 1 1 » + ITI
1S.MT11.70* ».75I 4.74.1 +T.1S* + 7.443 + 7.*75 + *.1 14 474M 1 474.101
----- ---
W
w
I
I
I
___________________________________________________ (4)
(4)
1
- MOVIMENTO M IGRATORIO
m)
Immigrazioni ed emigrazioni nel cono deU'aano
P O P O L A Z I O N I R E S I D E N T E
*1 K 3 E
•
P
n n m
4
U a i t i A V i
K a i« B 4 * i
H
1CaaaLaanto (
Eai<
.
Emimm
•crètti
boriiti
da altri
àmCm— ààk
U T E u m
la «Itti
m
C— i 4i
aTEata*
M a
h w tiria
di Tema
aHI* 1NVtMH
M Rana •
C a s i
M b
P
ii
it i a i
« T a te
«hl4 PrarUKM
M Ktpw
4
(rati
pati
fiati
grati
nel WffaCr» M a Pepelaa.
Iufcaai
h n a M
ItaKaai
Straafari
P iu irlia m i
Tata!* Total* Tatal. Tatala
* •
*
IL
M. f.
M.
».
a.
».
a.
r
a.
r.
ÌL r i . "
a 1 »•
aree 1937 .
— _ — _
S49 S39 1.444 1.4*4 SS 4*
IS 13 09 1SS SSl
« il
13
7
s
S «JS4 1.494 «.«47 l.*9*
!^
•
—
— — 449 444 1.4ST 14*S
«•
T4 i l
14 1U 11*
341 S*1 11 IS ì
• «.m
1.314 U N 1.1*9
— —
— — 349 360 1.1» 1.144
ss
34
4
T 118 IM 405 444 3
S
1
sto
1.17* S.17S 1.1TB
— —
— — 409 416 1-W1 1.344 SI
M S 3 114 IM 3*3 4M 1 13
s
IS IM S
1.US 3.MS1.111
—
— 1.197 311 342 313
IJM
1JM 49 41 14 11 141 113 S71 700
• • «
4 4JSS 1.71S 3.SSS 1.711
— — 42 33 S3t
243 4M 1.014 14 14
•
1*
134 i* t
3*3
«sa
U 11
1
S «93 1.171 U H 1 171
17
il
152 344 »14 •44 SI
11
•
IS 11* IM «11 «T« U l«
1
1 1.411 M1S
u n
1311
—
—
34 26 306 332
1.MSIM I
Al
11 IT SS 134 141 4M 474 1»
«
S.971
u n
L9M 1.4»
—
47 309 443 1.344 1.441 45 41
7 IT ITA 144 M I
491 IS S4
1
T 3,(17 1.471 3.744 L«7*
— — 17 37 SM 316
in*
l.(47 44* .
34 IS
o
119 IM 433 S1T IS IT M 1 U H 1.4M «M7 1.4M
— 26
U
sm
372 1.447 1.19T 34 14 11 19 144 131 SU 441 11 11
1
1 S.1M L4M S.47T 1.4(1
—
S
13 371 422 1.1M 1.7S4 «1 SS 9 11 UT MS SU 4M IT IS
•
1 S.*S3 IM I IM I
1-SM
» .
““
33 30 325 34$ U N 1.7*4 44 3*
14
n
UT US SI* •IS T IS S
(
S.74S
IMI
un
1.159
•Y4U I t t i
2
— 64
S9 1-2*3
1.359
MT? S.717 11*
«1 34 41
SM *»
U N U N M 49 M
•
A
4.743 U M 7 «.7»